Your payments platform processes 12,000 RPS across 180 Kubernetes pods. Over the past quarter, on-call SREs averaged 420 PagerDuty pages per week (60/day), 88% of which self-resolved within 3 minutes without customer impact. Last Tuesday, a real 22-minute P1 database connection-pool exhaustion in checkout-service was buried under 47 downstream timeout pages and auto-acknowledged by an exhausted engineer. Redesign the alerting and paging pipeline so only actionable, user-impacting incidents wake on-call engineers while preserving observability for transient anomalies.
From patterns to decisions.
Your payments platform processes 12,000 RPS across 180 Kubernetes pods. Over the past quarter, on-call SREs averaged 420 PagerDuty pages per week (60/day), 88% of which self-resolved within 3 minutes without customer impact. Last Tuesday, a real 22-minute P1 database connection-pool exhaustion in checkout-service was buried under 47 downstream timeout pages and auto-acknowledged by an exhausted engineer. Redesign the alerting and paging pipeline so only actionable, user-impacting incidents wake on-call engineers while preserving observability for transient anomalies.
Symptomless threshold alerts (CPU >85%.
Symptomless threshold alerts (CPU >85%, 1-minute 5xx spikes) created chronic false positives, while lack of dependency inhibition turned a single DB pool outage into 47 simultaneous pages.
| Choice | What it buys | What it costs |
|---|---|---|
| Trade-off 1 | Auditing historical incidents delays rule changes by 1-2 days but prevents accidentally silencing genuine P1 signals. |
Step 1
Audit PagerDuty incident logs over the last 30 days to compute the auto-resolve percentage per alert rule.
Step 2
Map upstream-to-downstream service dependencies to identify cascading alert storms.
Step 3
Define user-facing SLIs (HTTP 5xx ratio and p99 latency) and monthly error budgets.
Alternative 1
Immediate blanket suppression of all non-5xx alerts (risky without baseline SLO coverage).
Failure Mode 1
Confusing short-duration pages caused by human quick-fixes with genuine self-healing false positives.
-- Audit noisy alert rules from exported PagerDuty incident telemetry
SELECT alert_name,
       COUNT(*) AS total_pages,
       ROUND(100.0 * SUM(CASE WHEN duration_sec < 180 THEN 1 ELSE 0 END) / COUNT(*), 1) AS pct_auto_resolved
FROM pagerduty_incidents
WHERE created_at >= NOW() - INTERVAL '30 days'
GROUP BY alert_name
HAVING COUNT(*) > 10
ORDER BY pct_auto_resolved DESC;
Combine 14.
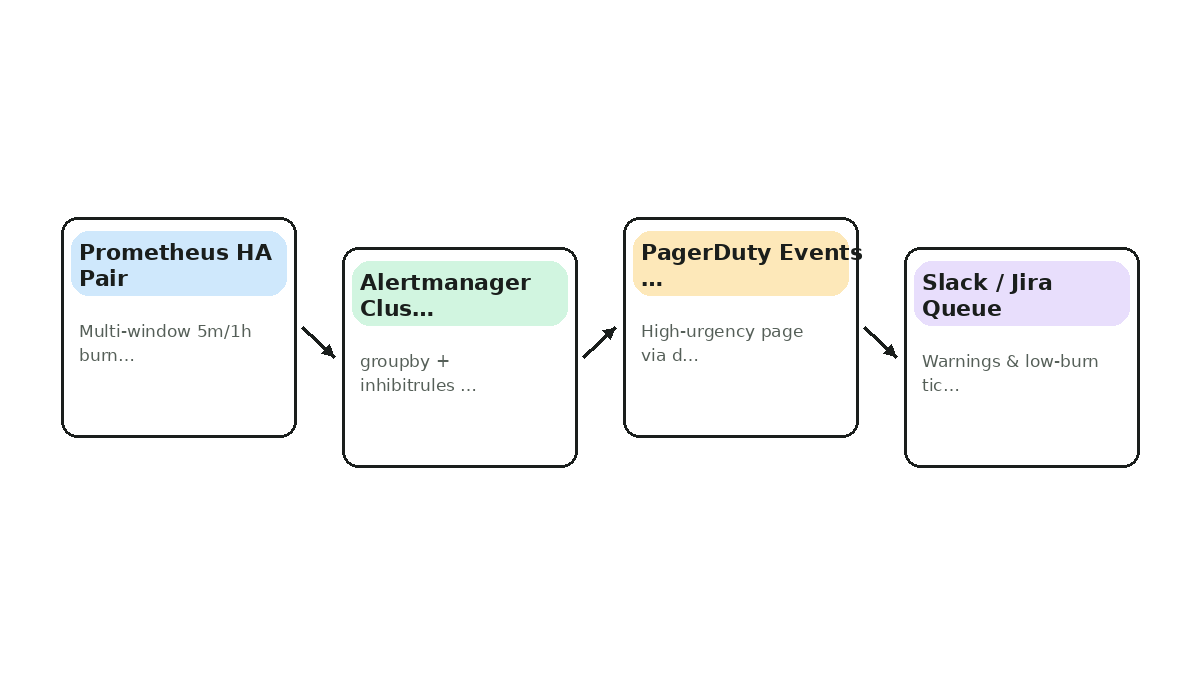
Combine 14.4x (1h & 5m) and 6x (6h & 30m) burn-rate rules with minimum RPS guards, Alertmanager inhibit_rules, and deterministic PagerDuty dedup_key templates.
| Choice | What it buys | What it costs |
|---|---|---|
| Trade-off 1 | Multi-window rules require 5-60 minutes of metric history; new services need 1 hour of warmup before burn-rate alerts stabilize. |
Step 1
Create Prometheus recording rules for 5m, 30m, 1h, and 6h error ratios.
Step 2
Gate paging alerts on both long and short windows exceeding the burn-rate threshold AND traffic > 10 RPS.
Step 3
Configure Alertmanager group_wait (30s), inhibit_rules for DB/upstream outages, and dedup_key without replica labels.
Alternative 1
Datadog or Sloth automated SLO generators that compile multi-window PromQL from a simple YAML SLO spec.
Failure Mode 1
Forgetting to strip the Prometheus 'replica' external label causes HA pairs to generate distinct dedup_keys.
inhibit_rules:
  - source_matchers: ['alertname="PostgresPrimaryDown"', 'severity="page"']
    target_matchers: ['severity=~"page|warning"', 'upstream_dep="postgres-primary"']
    equal: ['cluster']

receivers:
  - name: 'pagerduty-critical'
    pagerduty_configs:
      - dedup_key: '{{ .GroupLabels.cluster }}:{{ .GroupLabels.service }}:{{ .GroupLabels.alertname }}'
        severity: 'critical'
Implementation & Guardrails (3).
Dual-window gating requires sustained error budget consumption while resetting immediately when the 5m window recovers, eliminating both micro-bursts and long reset tails.
| Choice | What it buys | What it costs |
|---|---|---|
| Trade-off 1 | Gating on >10 RPS prevents false pages on admin endpoints, at the cost of requiring separate blackbox uptime checks for low-QPS APIs. |
Step 1
Compare 2-minute static threshold (fires on any 2-minute deploy blip) vs. 14.4x 1h+5m dual window.
Step 2
Add minimum RPS floor (>10 RPS) for ratio alerts or route low-QPS services to synthetic blackbox probes.
Alternative 1
Bayesian anomaly detection (high operational complexity and opaque thresholds).
Failure Mode 1
Using a 1h window alone without a 5m window causes alerts to stay firing for 55 minutes after an incident is already resolved.
def should_page_burn_rate(errors_5m: int, total_5m: int, errors_1h: int, total_1h: int, slo_target: float = 0.9995) -> bool:
    if total_5m < 3000:  # < 10 RPS over 5m (300s)
        return False
    budget = 1.0 - slo_target
    burn_5m = (errors_5m / total_5m) / budget
    burn_1h = (errors_1h / max(total_1h, 1)) / budget
    return burn_5m >= 14.4 and burn_1h >= 14.4
A single-instance Alertmanager is a.
A single-instance Alertmanager is a single point of failure for paging; a 3-node gossip mesh plus an external Watchdog heartbeat guarantees delivery.
| Choice | What it buys | What it costs |
|---|---|---|
| Trade-off 1 | Gossip mesh prevents duplicate pages under normal operation, but during a full gossip partition Alertmanager fails open (may send 2 pages rather than 0). |
Step 1
Deploy 3 Alertmanager replicas across 3 AZs joined via --cluster.peer.
Step 2
Configure Prometheus to send alerts to ALL Alertmanager endpoints (not behind a single load balancer).
Step 3
Route an always-firing Watchdog alert to an external heartbeat monitor that pages if silenced for >5 minutes.
Alternative 1
Managed alerting SaaS (Grafana Cloud / PagerDuty AIOps) to offload Alertmanager cluster ops.
Failure Mode 1
Putting Alertmanager behind a single Kubernetes ClusterIP Service instead of headless DNS causes Prometheus to only reach 1 pod.
alerting:
  alertmanagers:
    - static_configs:
        - targets:
            - alertmanager-0.monitoring:9093
            - alertmanager-1.monitoring:9093
            - alertmanager-2.monitoring:9093
Implementation & Guardrails (5).
Continuous alert governance prevents threshold drift by flagging rules with high auto-resolve rates or zero-action acknowledgments every Monday.
| Choice | What it buys | What it costs |
|---|---|---|
| Trade-off 1 | Automated weekly reports create mild process overhead but prevent alert rot over quarters. |
Step 1
Query PagerDuty /incidents API for the prior 7 days.
Step 2
Compute auto-resolve rate and median time-to-resolve per alert service/title.
Step 3
Post a weekly Slack digest to service owners for any rule exceeding 20% noise.
Alternative 1
Enforcing CI/CD policy checks (Conftest/OPA) blocking any new PrometheusRule without a runbook_url and for-duration.
Failure Mode 1
Ignoring warning-tier Slack noise until engineers mute the #ops-triage channel too.
import requests

def audit_noisy_alerts(pd_token: str, since_iso: str) -> list[dict]:
    resp = requests.get(
        "https://api.pagerduty.com/incidents",
        headers={"Authorization": f"Token token={pd_token}"},
        params={"since": since_iso, "limit": 100, "statuses[]": "resolved"},
        timeout=10,
    )
    resp.raise_for_status()
    return [i for i in resp.json()["incidents"] if i.get("resolve_reason") is None]
Theory & Tips and Tricks
Practical heuristics & interview traps
- 01Interview anchor: Replace symptom-based infrastructure thresholds with multi-window SLO burn-rate alerts, Alertmanager inhibition/grouping, and deterministic dedup_key routing.
- 02Trade-off tip: Gating on >10 RPS prevents false pages on admin endpoints, at the cost of requiring separate blackbox uptime checks for low-QPS APIs.
- 03Watch out for: Putting Alertmanager behind a single Kubernetes ClusterIP Service instead of headless DNS causes Prometheus to only reach 1 pod.
Slo Based Alerting Burn Rates — Normal → Load / Fault → Recovery
Replace symptom-based infrastructure thresholds with multi-window SLO burn-rate alerts, Alertmanager inhibition/grouping, and deterministic dedupkey routing.
Putting Eliminating Alert Fatigue with SLO Burn-Rate Alerts Together
Replace symptom-based infrastructure thresholds with multi-window SLO burn-rate alerts, Alertmanager inhibition/grouping, and deterministic dedup_key routing.
Putting Eliminating Alert Fatigue with SLO Burn-Rate Alerts Together
- Create Prometheus recording rules for 5m, 30m, 1h, and 6h error ratios.
- Gate paging alerts on both long and short windows exceeding the burn-rate threshold AND traffic > 10 RPS.
- Configure Alertmanager group_wait (30s), inhibit_rules for DB/upstream outages, and dedup_key without replica labels.
Interview Readiness Check
A single-instance Alertmanager is a single point of failure for paging; a 3-node gossip mesh plus an external Watchdog heartbeat guarantees delivery.
Walk through bottlenecks, back-of-the-envelope math, and failure recovery.
Make the trade-off yourself.
Practice Check
Test your understanding
When is ACID Transaction Fundamentals the right default for a production team?
Eliminating Alert Fatigue with SLO Burn-Rate Alerts
Replace symptom-based infrastructure thresholds with multi-window SLO burn-rate alerts, Alertmanager inhibition/grouping, and deterministic dedup_key routing.