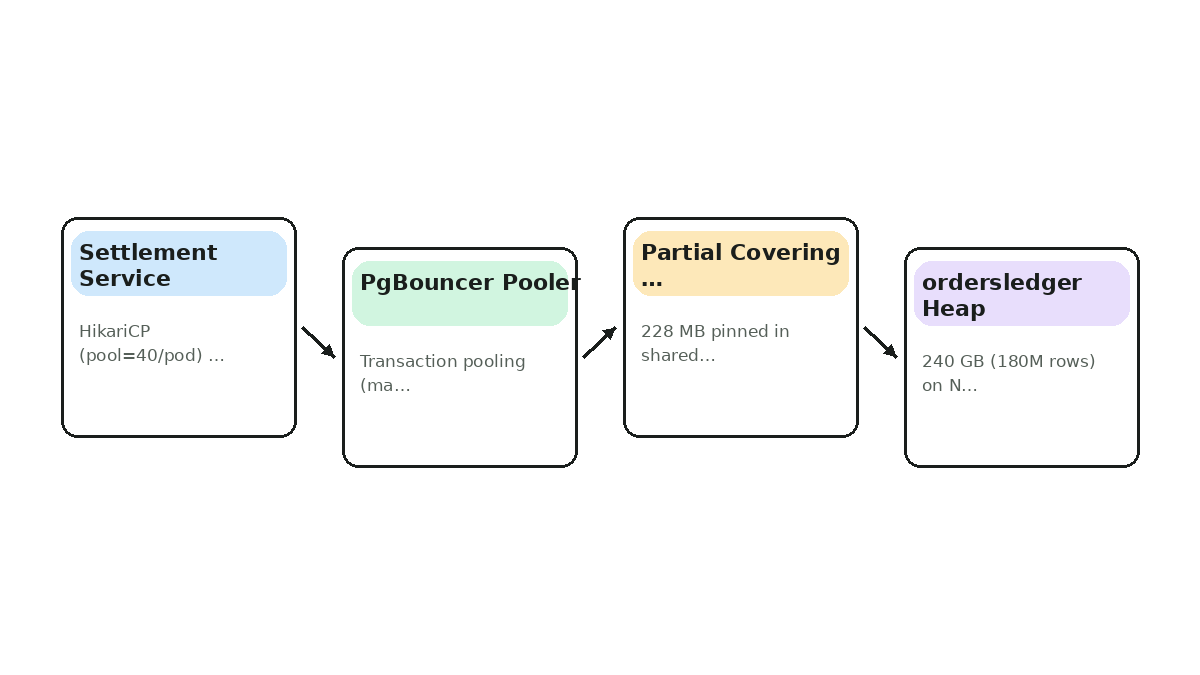
A payment settlement service queries a 180M-row PostgreSQL 16 `orders_ledger` table (240 GB heap) using `WHERE merchant_id = $1 AND status = 'PENDING_SETTLEMENT' ORDER BY created_at DESC LIMIT 50`. Only `PRIMARY KEY (order_id)` and an index on `(created_at)` exist. During peak payout windows (2,400 QPS), p99 latency jumps from 12 ms to 14.8 s, NVMe read IOPS hit the 16,000 IOPS ceiling, `shared_buffers` (32 GB) thrash, and all 500 HikariCP connections block. Design the remediation and long-term guardrails without causing table-write downtime.
From patterns to decisions.
A payment settlement service queries a 180M-row PostgreSQL 16 `orders_ledger` table (240 GB heap) using `WHERE merchant_id = $1 AND status = 'PENDING_SETTLEMENT' ORDER BY created_at DESC LIMIT 50`. Only `PRIMARY KEY (order_id)` and an index on `(created_at)` exist. During peak payout windows (2,400 QPS), p99 latency jumps from 12 ms to 14.8 s, NVMe read IOPS hit the 16,000 IOPS ceiling, `shared_buffers` (32 GB) thrash, and all 500 HikariCP connections block. Design the remediation and long-term guardrails without causing table-write downtime.
With no index leading on.
With no index leading on merchant_id, PostgreSQL falls back to either a 240 GB Sequential Scan or a Backward Index Scan on (created_at) that discards 99.8% of rows via random heap fetches.
| Choice | What it buys | What it costs |
|---|---|---|
| Trade-off 1 | Using `EXPLAIN` alone estimates costs from `pg_statistic` without executing; `EXPLAIN (ANALYZE, BUFFERS)` reveals actual heap fetches and disk reads. |
Step 1
Run EXPLAIN (ANALYZE, BUFFERS) on the exact parameterized query to observe shared hit vs shared read blocks.
Step 2
Check pg_stat_statements for shared_blks_read and blk_read_time to confirm I/O wait is the primary bottleneck.
Step 3
Compare table size (240 GB) against shared_buffers (32 GB) to verify working-set eviction.
Alternative 1
Inspect pg_stat_user_tables (seq_scan, seq_tup_read) to identify tables with high sequential-scan tuple volume.
Failure Mode 1
Running EXPLAIN ANALYZE on a hot-cached staging DB with 100k rows masks the 240 GB disk thrashing seen in production.
EXPLAIN (ANALYZE, BUFFERS)
SELECT order_id, amount_cents, currency, created_at
FROM orders_ledger
WHERE merchant_id = 'm_98421'
  AND status = 'PENDING_SETTLEMENT'
ORDER BY created_at DESC
LIMIT 50;
A partial covering index (merchant_id.
A partial covering index (merchant_id, created_at DESC) INCLUDE (amount_cents, currency) WHERE status = 'PENDING_SETTLEMENT' shrinks the index to 228 MB, enabling sub-millisecond Index-Only Scans in RAM.
| Choice | What it buys | What it costs |
|---|---|---|
| Trade-off 1 | Partial index only accelerates `PENDING_SETTLEMENT` queries; queries for `SETTLED` orders must be routed to a read replica or given a separate index. |
Step 1
Set lock_timeout = '200ms' and maintenance_work_mem = '2GB' in the migration session.
Step 2
Execute CREATE INDEX CONCURRENTLY so INSERT/UPDATE traffic continues uninterrupted.
Step 3
Tune autovacuum_vacuum_scale_factor = 0.02 so Visibility Map bits stay clean for Index-Only Scans.
Step 4
Enforce statement_timeout = 1500ms in HikariCP/PostgreSQL role settings and route through PgBouncer.
Alternative 1
Full composite index (merchant_id, status, created_at DESC) (~8.6 GB) if all statuses are queried equally on the OLTP primary.
Failure Mode 1
Forgetting lock_timeout during CREATE INDEX CONCURRENTLY can cause the index build to stall behind a long-running analytical transaction.
HikariConfig config = new HikariConfig();
config.setJdbcUrl("jdbc:postgresql://pgbouncer.prod.internal:6432/payments");
config.setMaximumPoolSize(40);
config.setConnectionTimeout(1000);
config.addDataSourceProperty("options", "-c statement_timeout=1500 -c lock_timeout=200");
config.addDataSourceProperty("prepareThreshold", "3");
Implementation & Guardrails (3).
Equality columns (merchant_id) must precede sort/range columns (created_at DESC) so PostgreSQL can seek directly to the merchant's newest 50 rows without an explicit Sort node.
| Choice | What it buys | What it costs |
|---|---|---|
| Trade-off 1 | Adding `INCLUDE` columns increases leaf page size slightly (~16 bytes/row) but eliminates random 8 KB heap page fetches. |
Step 1
Place equality predicates first (merchant_id), followed by ORDER BY columns (created_at DESC).
Step 2
Move status = 'PENDING_SETTLEMENT' into the WHERE partial-index predicate to eliminate 96.8% of rows.
Step 3
Place non-filtered projection columns (amount_cents, currency) in INCLUDE so they do not bloat internal B-Tree branch pages.
Alternative 1
Range-partitioning orders_ledger by month on created_at to keep active partitions small, though cross-partition queries for old pending orders still require per-partition indexes.
Failure Mode 1
Indexing (created_at DESC, merchant_id) forces PostgreSQL to scan across all merchants' timestamps.
-- Optimal: 228 MB, Index-Only Scan, 0 Sort nodes
CREATE INDEX CONCURRENTLY idx_orders_pending_merchant_created
ON orders_ledger (merchant_id, created_at DESC)
INCLUDE (amount_cents, currency)
WHERE status = 'PENDING_SETTLEMENT';
Heavy UPDATE churn clears Visibility.
Heavy UPDATE churn clears Visibility Map bits, degrading Index-Only Scans into Index Scans with random heap fetches, while failed concurrent index builds leave write-amplifying INVALID indexes.
| Choice | What it buys | What it costs |
|---|---|---|
| Trade-off 1 | Aggressive `autovacuum` consumes extra background NVMe write bandwidth (~5-10%) in exchange for predictable read latency. |
Step 1
Monitor pg_stat_user_tables.n_dead_tup and Heap Fetches in EXPLAIN ANALYZE.
Step 2
Increase autovacuum_vacuum_cost_limit on orders_ledger so vacuum keeps up with status transitions.
Step 3
Alert on pg_index.indisvalid = false and pg_stat_statements shared_blks_read spikes.
Alternative 1
Offload historical SETTLED order queries to a dedicated PostgreSQL read replica with a separate statement_timeout.
Failure Mode 1
Leaving maximumPoolSize at 500 during a disk regression starves CPU and locks up the DB even faster.
groups:
  - name: postgres-query-regression
    rules:
      - alert: PostgresHighDiskReadsPerQuery
        expr: rate(pg_stat_statements_shared_blks_read_total[1m]) / rate(pg_stat_statements_calls_total[1m]) > 500
        for: 2m
        labels:
          severity: critical
        annotations:
          summary: "Query reading >500 blocks/call from disk; check missing index or VM bloat."
Combine CI-level query plan assertions.
Combine CI-level query plan assertions against production-like pg_statistic snapshots with runtime pg_stat_statements regression alerts and hypopg index verification.
| Choice | What it buys | What it costs |
|---|---|---|
| Trade-off 1 | CI plan checks require representative table statistics (`ANALYZE` or stats-dump), otherwise PostgreSQL defaults to small-table sequential scans. |
Step 1
Export anonymized pg_statistic / table row counts to CI or use hypopg to validate query plans.
Step 2
Fail CI if any new SQL query triggers a Seq Scan or exceeds a total_cost threshold on tables >1M rows.
Step 3
Configure auto_explain.log_min_duration = '200ms' with auto_explain.log_buffers = on in staging and canary.
Alternative 1
Use pg_stat_statements diffing in canary deployments to block rollout if shared_blks_read per call increases >2x.
Failure Mode 1
Testing against an empty or 1,000-row CI database causes PostgreSQL to legitimately choose Seq Scan, creating false positives.
import psycopg

def assert_no_seq_scan(conn, sql, params):
    plan = conn.execute(f"EXPLAIN (FORMAT JSON) {sql}", params).fetchone()[0][0]["Plan"]
    def walk(node):
        if node.get("Node Type") == "Seq Scan" and node.get("Relation Name") == "orders_ledger":
            raise AssertionError("Forbidden Seq Scan on orders_ledger")
        for child in node.get("Plans", []):
            walk(child)
    walk(plan)
Theory & Tips and Tricks
Practical heuristics & interview traps
- 01Interview anchor: Align B-Tree composite key order (equality columns first, range/sort columns second) with partial/covering clauses, enforce statement_timeout, and gate query plans in CI.
- 02Trade-off tip: Adding
INCLUDEcolumns increases leaf page size slightly (~16 bytes/row) but eliminates random 8 KB heap page fetches. - 03Watch out for: Leaving
maximumPoolSizeat 500 during a disk regression starves CPU and locks up the DB even faster.
Eliminating Full Table Scans With Indexes — Normal → Load / Fault → Recovery
Align B-Tree composite key order (equality columns first, range/sort columns second) with partial/covering clauses, enforce statementtimeout, and gate query plans in CI.
Putting Eliminating Full Table Scans Under Concurrency Together
Align B-Tree composite key order (equality columns first, range/sort columns second) with partial/covering clauses, enforce statement_timeout, and gate query plans in CI.
Putting Eliminating Full Table Scans Under Concurrency Together
- Set
lock_timeout = '200ms'andmaintenance_work_mem = '2GB'in the migration session. - Execute
CREATE INDEX CONCURRENTLYsoINSERT/UPDATEtraffic continues uninterrupted. - Tune
autovacuum_vacuum_scale_factor = 0.02so Visibility Map bits stay clean for Index-Only Scans. - Enforce
statement_timeout = 1500msin HikariCP/PostgreSQL role settings and route through PgBouncer.
Interview Readiness Check
Heavy UPDATE churn clears Visibility Map bits, degrading Index-Only Scans into Index Scans with random heap fetches, while failed concurrent index builds leave write-amplifying INVALID indexes.
Walk through bottlenecks, back-of-the-envelope math, and failure recovery.
Make the trade-off yourself.
Practice Check
Test your understanding
When is ACID Transaction Fundamentals the right default for a production team?
Eliminating Full Table Scans Under Concurrency
Align B-Tree composite key order (equality columns first, range/sort columns second) with partial/covering clauses, enforce statement_timeout, and gate query plans in CI.