After a release added `user_id`, `trace_id`, and un-normalized `path` (`/orders/ord_991823/items`) labels to `http_server_requests_seconds_bucket`, Prometheus active series jumped from 420,000 to 18,400,000 in 20 minutes. The 64 GB Prometheus pod OOM-kills (`Exit Code 137`) every 9 minutes during TSDB head-block WAL replay and compaction, leaving all Grafana dashboards and Alertmanager rules blind.
From patterns to decisions.
After a release added `user_id`, `trace_id`, and un-normalized `path` (`/orders/ord_991823/items`) labels to `http_server_requests_seconds_bucket`, Prometheus active series jumped from 420,000 to 18,400,000 in 20 minutes. The 64 GB Prometheus pod OOM-kills (`Exit Code 137`) every 9 minutes during TSDB head-block WAL replay and compaction, leaving all Grafana dashboards and Alertmanager rules blind.
A 15-bucket histogram creates 18.
A 15-bucket histogram creates 18 series per label combination (18.4M total), consuming ~92 GB of head-block RAM.
| Choice | What it buys | What it costs |
|---|---|---|
| Trade-off 1 | Histograms enable quantile aggregation across pods but multiply cardinality by bucket count + 3. |
Step 1
Multiply label tuples by 18 histogram series.
Step 2
Multiply 18.4M series by ~5 KB head-block RAM per series.
Alternative 1
Prometheus Native Histograms (exponential buckets, 1 series per label tuple).
Failure Mode 1
OOM loop during WAL replay prevents Prometheus from even reading new configs.
# Inspect top cardinality metrics via TSDB status API
# GET /api/v1/status/tsdb -> seriesCountByMetricName
Drop metrics carrying user_id/trace_id via.
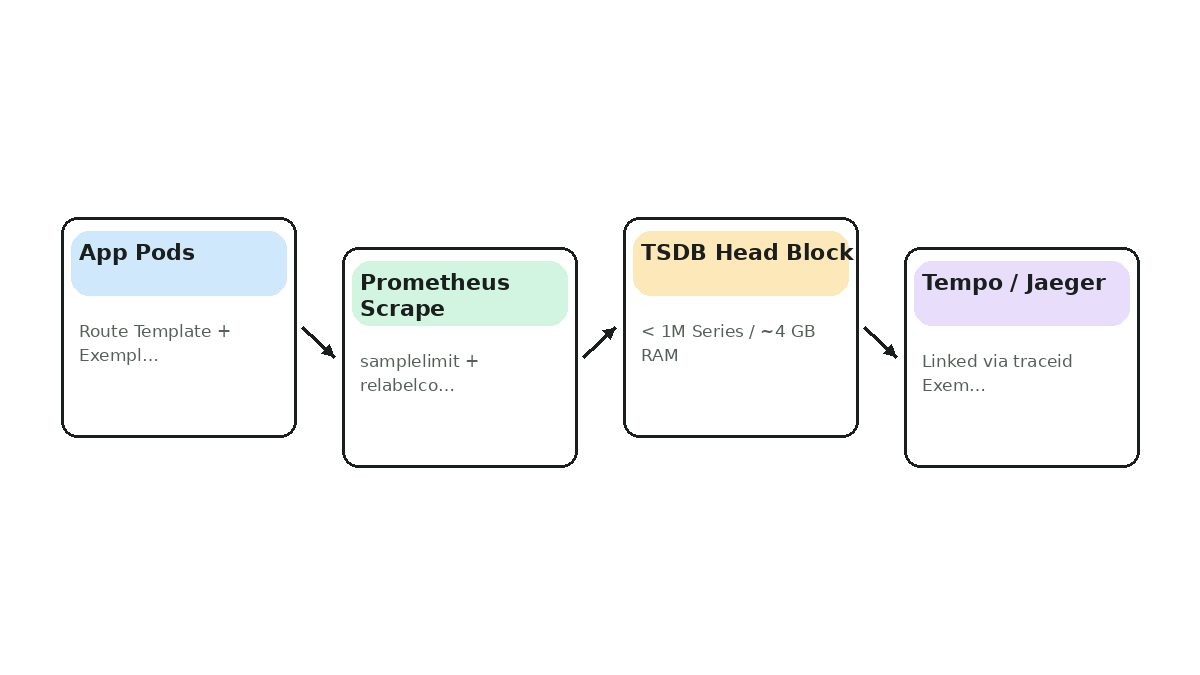
Drop metrics carrying user_id/trace_id via metric_relabel_configs, enforce sample_limit: 50000, and normalize routes in app middleware.
| Choice | What it buys | What it costs |
|---|---|---|
| Trade-off 1 | sample_limit rejects the bad target's scrape rather than crashing Prometheus for the entire cluster. |
Add sample_limit
50000 and action: drop for bad labels.
Step 2
Replace raw URI with route template + UNMATCHED fallback.
Step 3
Use Exemplars for trace_id.
Alternative 1
OpenTelemetry Collector metricstransform processor before Prometheus remote_write.
Failure Mode 1
Using labeldrop instead of drop causes duplicate-timestamp collisions.
scrape_configs:
  - job_name: 'api'
    sample_limit: 50000
    metric_relabel_configs:
      - source_labels: [user_id]
        regex: '.+'
        action: drop
Implementation & Guardrails (3).
labeldrop collapses distinct user_id series from the same pod into identical metric names with different values at the same scrape timestamp, causing ingestion collisions.
| Choice | What it buys | What it costs |
|---|---|---|
| Trade-off 1 | Temporarily loses that metric for offending pods until fixed, but guarantees clean TSDB ingestion. |
Step 1
Trace two users scraped from the same pod at timestamp T after stripping user_id.
Alternative 1
Drop only the offending metric name with regex: 'http_server_requests_seconds.*;.+'.
Failure Mode 1
TSDB rejects colliding samples and logs thousands of duplicate-sample warnings.
# Safe: drop the entire poisoned series until app rolls out fix
- source_labels: [user_id]
  regex: '.+'
  action: drop
Map all unmatched/404 routes to.
Map all unmatched/404 routes to a constant route="UNMATCHED" label before recording metrics.
| Choice | What it buys | What it costs |
|---|---|---|
| Trade-off 1 | Loses per-URL 404 counts in Prometheus (still available in Ingress access logs), while making Prometheus immune to URL-scan attacks. |
Step 1
Check if router matched a registered endpoint; if None/404, set route='UNMATCHED'.
Alternative 1
Normalize numeric/UUID segments with regex in middleware.
Failure Mode 1
404 scanner traffic creating millions of series.
route_label = request.scope["route"].path if request.scope.get("route") else "UNMATCHED"
Implementation & Guardrails (5).
Enable OpenMetrics Exemplars (--enable-feature=exemplar-storage), which attach one trace_id per histogram bucket update without creating new time series.
| Choice | What it buys | What it costs |
|---|---|---|
| Trade-off 1 | Fixed ring-buffer memory (~100K exemplars) gives direct trace links with zero cardinality explosion. |
Step 1
Enable exemplar storage in Prometheus and scrape via OpenMetrics.
Step 2
Attach trace_id in the OTel/Micrometer histogram observation.
Alternative 1
Filter Tempo/Jaeger directly by service + duration > 500ms in the incident time window.
Failure Mode 1
Using Prometheus classic text format instead of OpenMetrics drops exemplars.
args:
  - --enable-feature=exemplar-storage
  - --storage.exemplars.max-exemplars=100000
Theory & Tips and Tricks
Practical heuristics & interview traps
- 01Interview anchor: Keep Prometheus labels strictly bounded (low cardinality); drop or normalize dynamic labels via
metric_relabel_configsat scrape time and move per-user/per-request dimensions to logs or distributed traces. - 02Trade-off tip: Temporarily loses that metric for offending pods until fixed, but guarantees clean TSDB ingestion.
- 03Watch out for: 404 scanner traffic creating millions of series.
Controlling Prometheus Metric Cardinality — Normal → Load / Fault → Recovery
Keep Prometheus labels strictly bounded (low cardinality); drop or normalize dynamic labels via metricrelabelconfigs at scrape time and move per-user/per-request dimensions to logs or distributed traces.
Putting Controlling Prometheus High-Cardinality Metrics Together
Keep Prometheus labels strictly bounded (low cardinality); drop or normalize dynamic labels via `metric_relabel_configs` at scrape time and move per-user/per-request dimensions to logs or distributed traces.
Putting Controlling Prometheus High-Cardinality Metrics Together
- Add sample_limit: 50000 and action: drop for bad labels.
- Replace raw URI with route template + UNMATCHED fallback.
- Use Exemplars for trace_id.
Interview Readiness Check
Map all unmatched/404 routes to a constant route="UNMATCHED" label before recording metrics.
Walk through bottlenecks, back-of-the-envelope math, and failure recovery.
Make the trade-off yourself.
Practice Check
Test your understanding
When is ACID Transaction Fundamentals the right default for a production team?
Controlling Prometheus High-Cardinality Metrics
Keep Prometheus labels strictly bounded (low cardinality); drop or normalize dynamic labels via metric_relabel_configs at scrape time and move per-user/per-request dimensions to logs or distributed traces.